 CRM
How to Manage Reporting in CRM
The Reporting function provides a platform for thoroughly analyzing numerous activities and their status about the company’s operations. These sophisticated reporting tools increase productivity by providing an accurate assessment of the overall performance of the business. In CRM, the Forecast, Pipeline, Leads, Activities, Partnerships, and Lead Generation Views menus are located in the dropdown list of the Reporting tab.
Forecast:
The Forecast window will provide possibilities sorted by the months of ‘Expected Closing.’
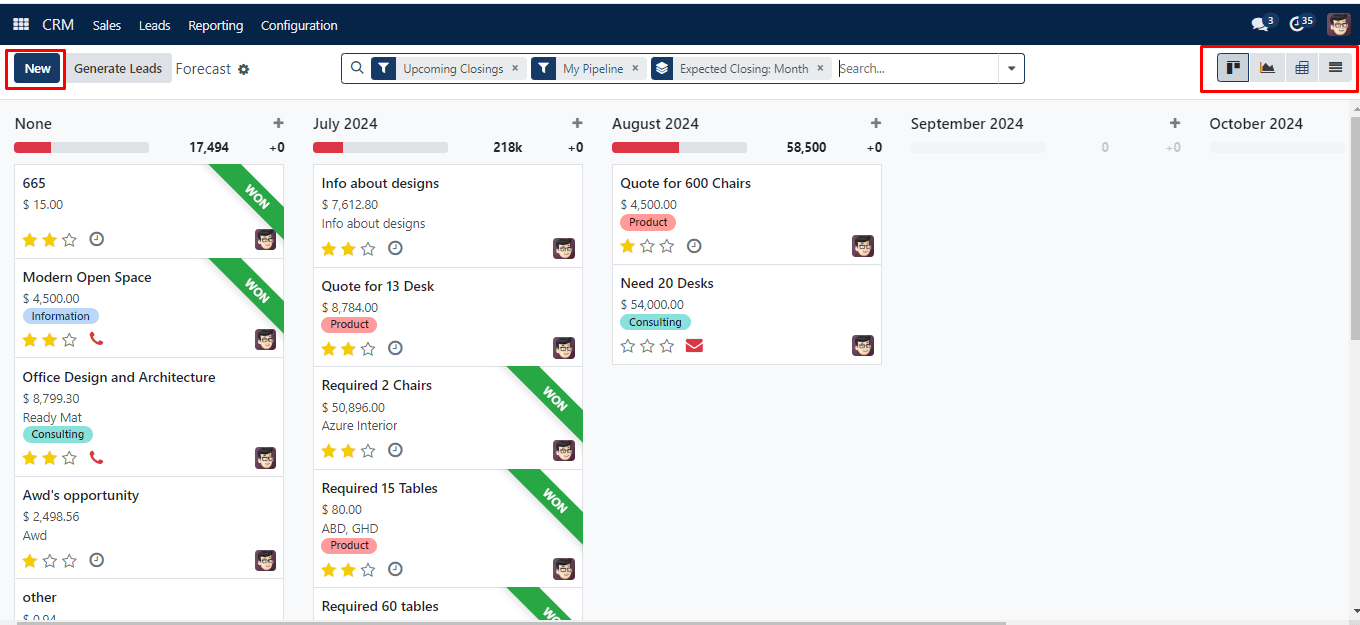
To change the display of this information, utilize the four icons in the upper right corner of the window: Kanban, Graph, Pivot, and List. You have many alternatives thanks to the Filters and Group By features to find and identify the necessary data. Additionally, you may establish default criteria for isolating records or store your regularly used filters using “Favourites.”
To create a new opportunity right from this window, click the Create button.
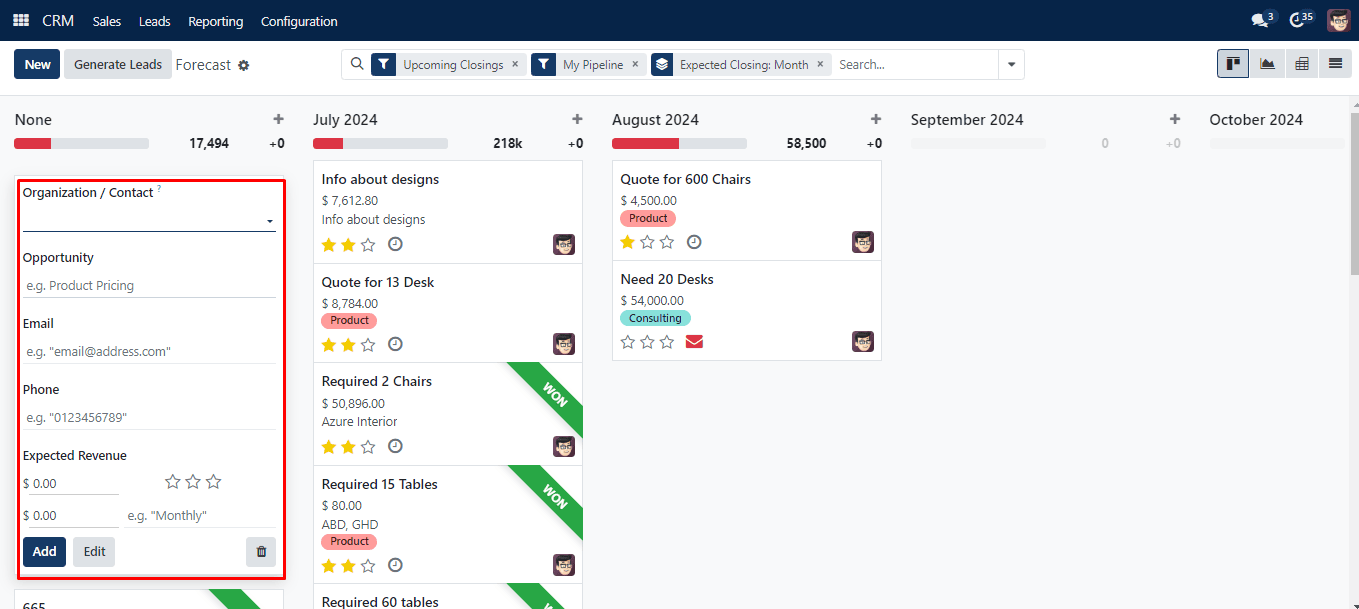
A new dialogue box will appear, allowing you to add information such as Organization/Contact, Opportunity, Email, Phone, and Expected Revenue. Lastly, choose “Add.”
Pipeline:
Various measurements can be used to analyze pipeline activity.
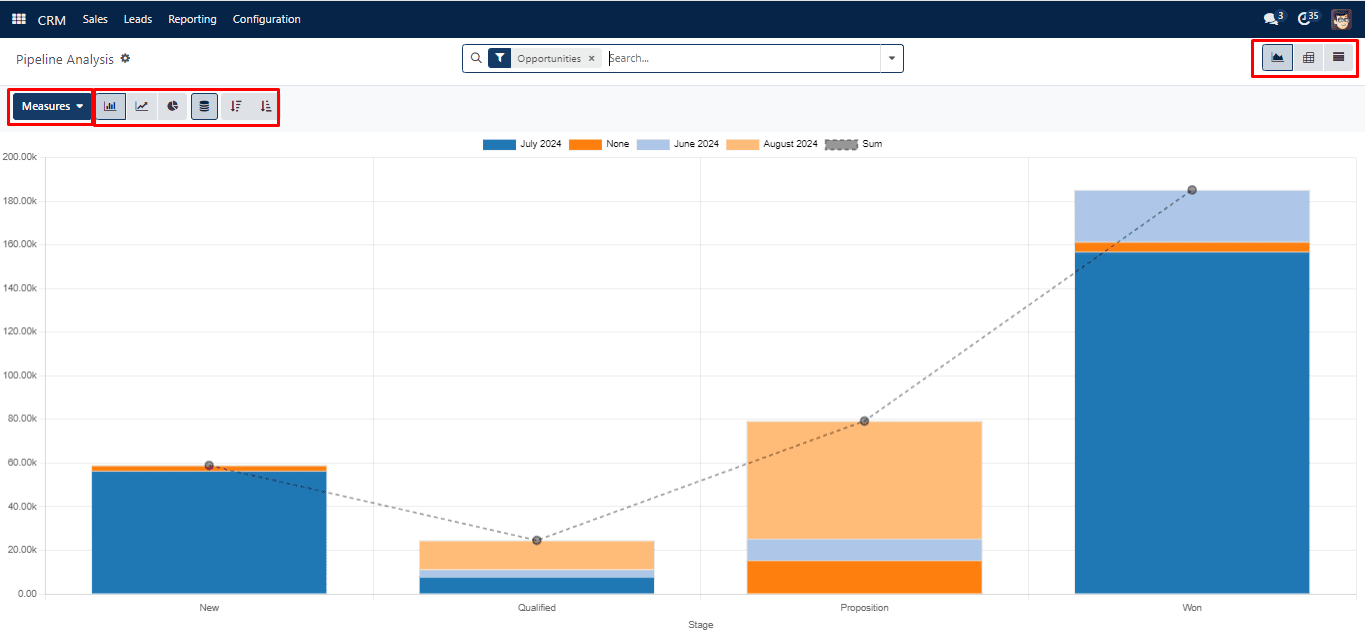
You may examine the reports in the Pipeline Analysis window in three different ways: graph, pivot, and list. Any icon in the window’s upper right corner can be clicked. The kind of graphical representation—a bar chart, line chart, or pie chart—can also be changed.
Leads:
You may evaluate all lead-related activity by using the Leads Analysis function found on the Reporting tab.
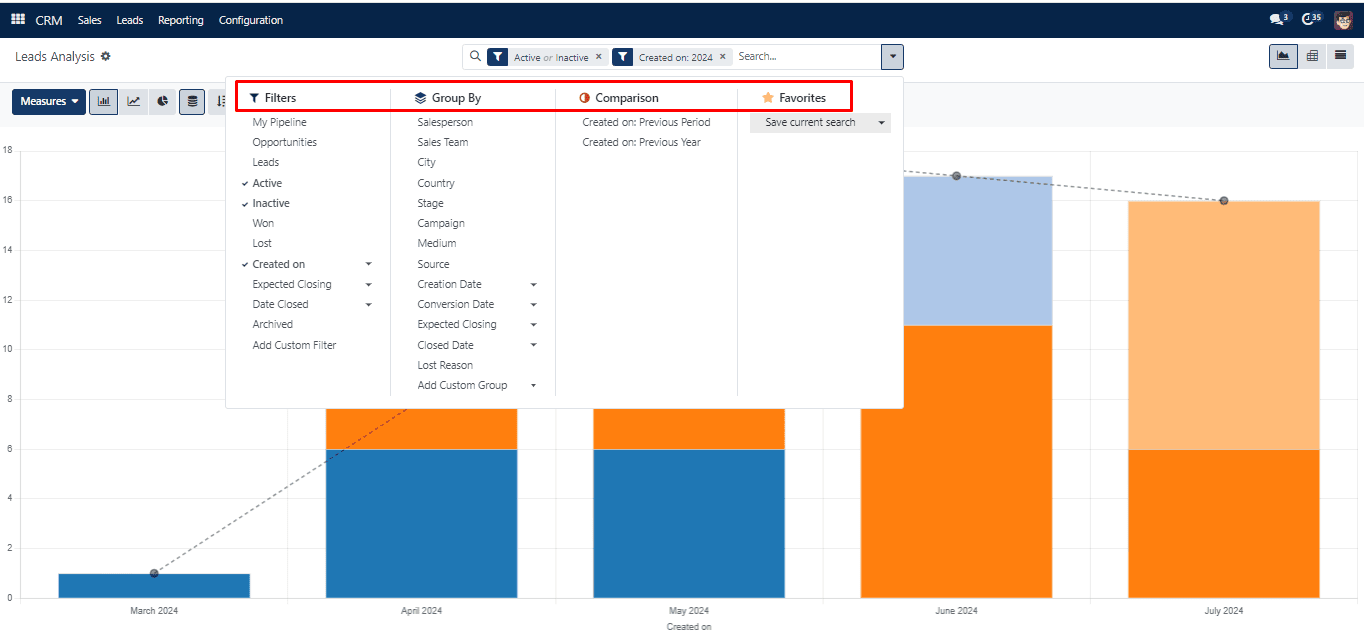
You may search and sort the lead data according to particular standards using the Filters and Group By options. The drop-down selection for “Comparison” contains the following two options: “Created on: Previous Period” and “Created on: Previous Year.” You may examine and filter the lead data from the prior quarter or year by using these choices. A platform to save and set as defaults for particular filters is provided by the Favorites feature.
Activities:
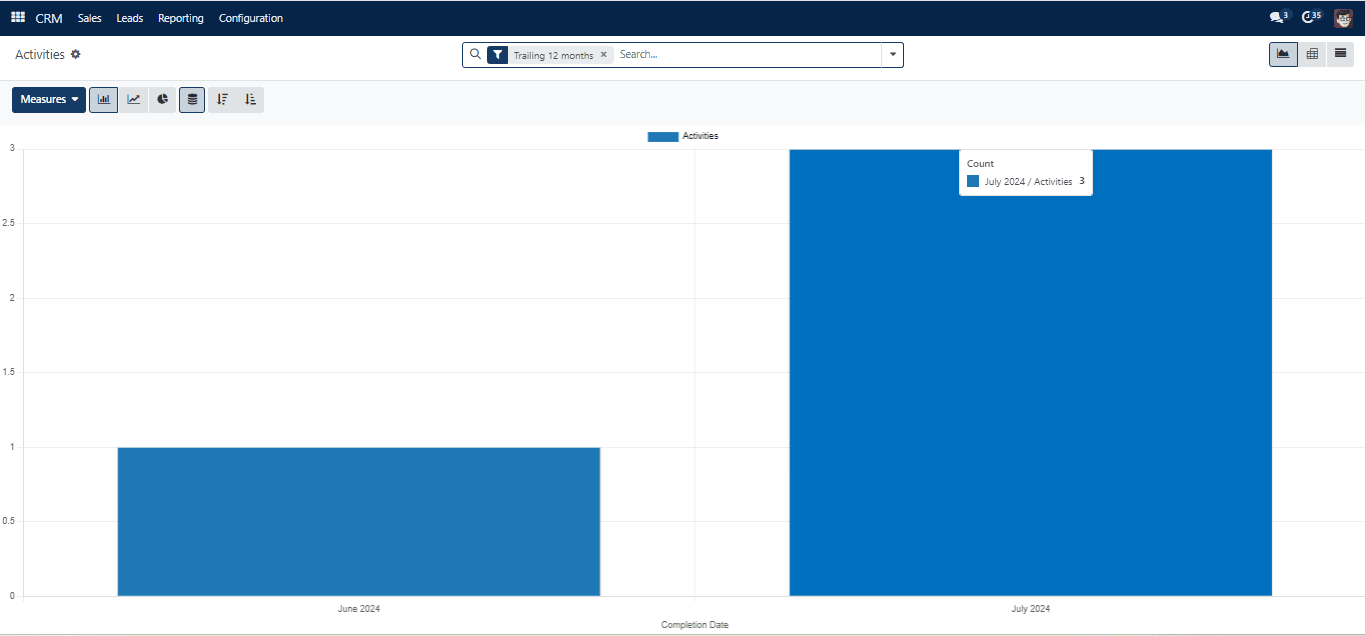
You may get a detailed analysis of every activity in the pipeline in the Pipeline Activities window located in the reporting section.